Reconstructing climate during former warm periods in subarctic Canada
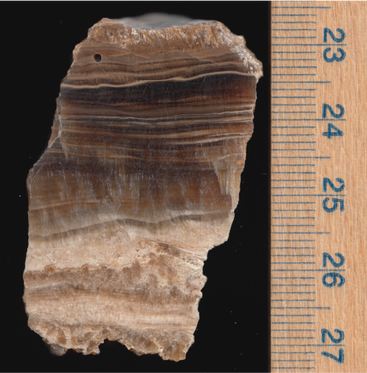
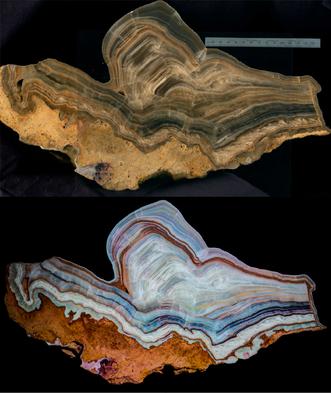
Sample D3Flowstone sample <5 cm in length
|
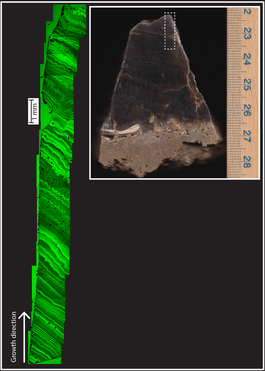
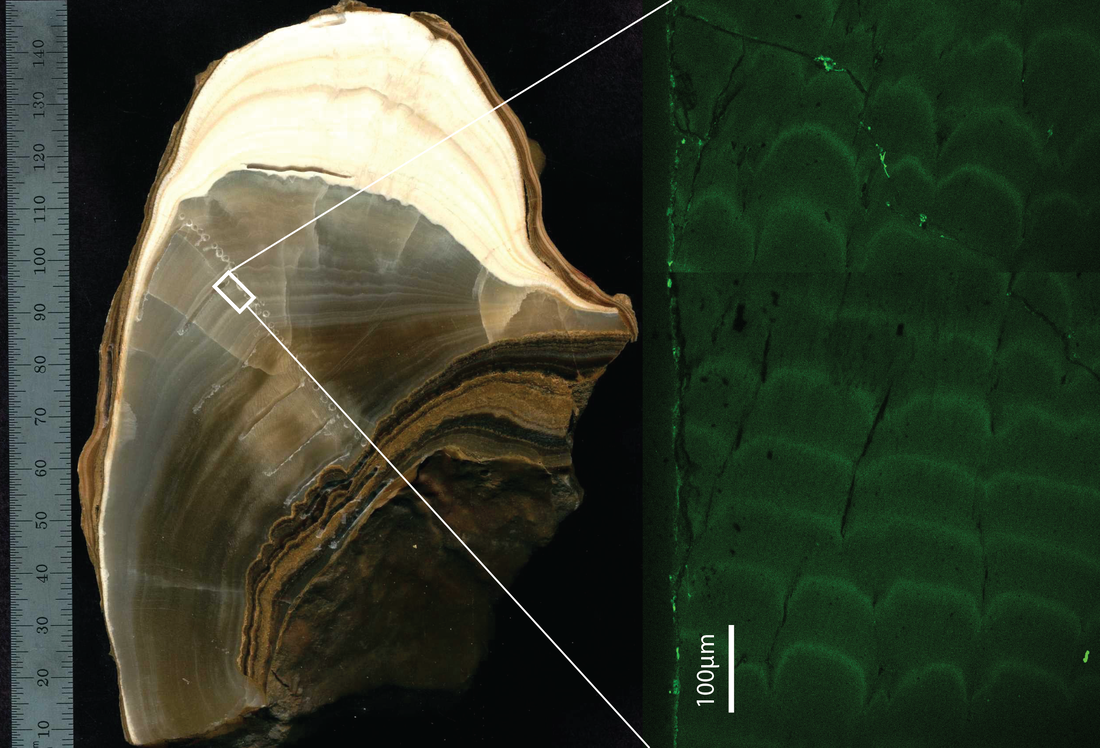
Sample A4, with fluorescent bandingFlowstone sample with confocal laser fluorescent microscopy (CLFM) image, showing distinct fluorescent banding
|
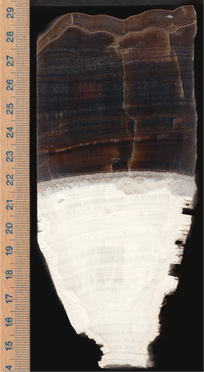
Sample A2Flowstone with aragonite at the base (white)
|
|
I use speleothems to reconstruct paleoclimate. For my PhD, I worked at a cave in south-central Wisconsin and reconstructed mid-continental, mid-latitude climate for the last 250,000 years. Speleothems form from meteoric water that drips into cave systems, and therefore records the oxygen isotope composition of rain water through time. These oxygen isotopes can tell us about temperature and precipitation pattern changes, and they manifest themselves within individual calcite growth layers of speleothem samples which can be measured using geochemical techniques. The speleothems I work on - however - grow in a mid-continental and mid-latitude setting, and therefore are very slow growing (~0.5-1mm/1kyr). This means we need use high-resolution techniques to measure the dO18 within these speleothem growth bands. These techniques include confocal laser fluorescent microscopy (CFLM; left image) and the Secondary Ion Mass Spectrometer (SIMS).
|
|
|
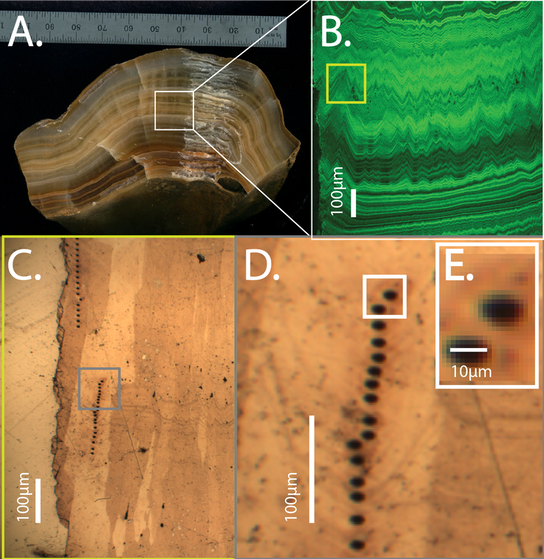
The Secondary Ion Mass Spectrometer (SIMS:
www.geology.wisc.edu/~wiscsims/) is able to make in situ stable isotope geochemical analyses that are 10 microns in size (panel D-E). When paired with imaging by confocal laser fluorescent microscopy (panel B) this allows for the precise measurement of oxygen isotope values within individual speleothem growth bands. Panel A: A speleothem sample from Cave oft he Mounds that is ~50 mm long and grew over ~30,000 years. Panel B: A zoom-in of a confocal laser fluorescent microscopy image of this speleothem sample, demonstrating fine-resolution (<100 microns) fluorescent banding. Bright bands are from increased organic matter content (rainy season), while darker bands have less organic content (drier season). Panel C: A white light image of the same speleothem sample, showing the scale of individual SIMS analysis points (black dots). Panel D-E: A zoom-in showing the 10-micron size of a SIMS pit. This shows how individual growth bands can be analyzed for oxygen isotope composition, and therefore sub-annual paleoclimate can be reconstructed in these samples. |
|
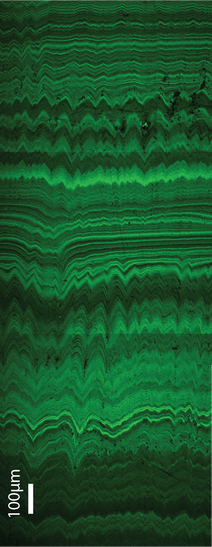
An example of clear annual fluorescent banding in a speleothem sample. This sample is also from south-central Wisconsin (used for my dissertation), and the bright fluorescent bands represent rainy periods (the wet season) when lots of organic material was flushed into the cave, while the dark bands represent the drier season. The bright + dark couplets represent 1 year of time, and therefore the SIMS can be used on this sample to reconstruct sub-annual paleoclimate in the mid-continent. What's very interesting about this specific sample is that it grew during the Eemian period - therefore we can reconstruct seasonality in the mid-continent during the last time in Earth's history it was as warm (if not warmer) than today!
|
|
